Documentation
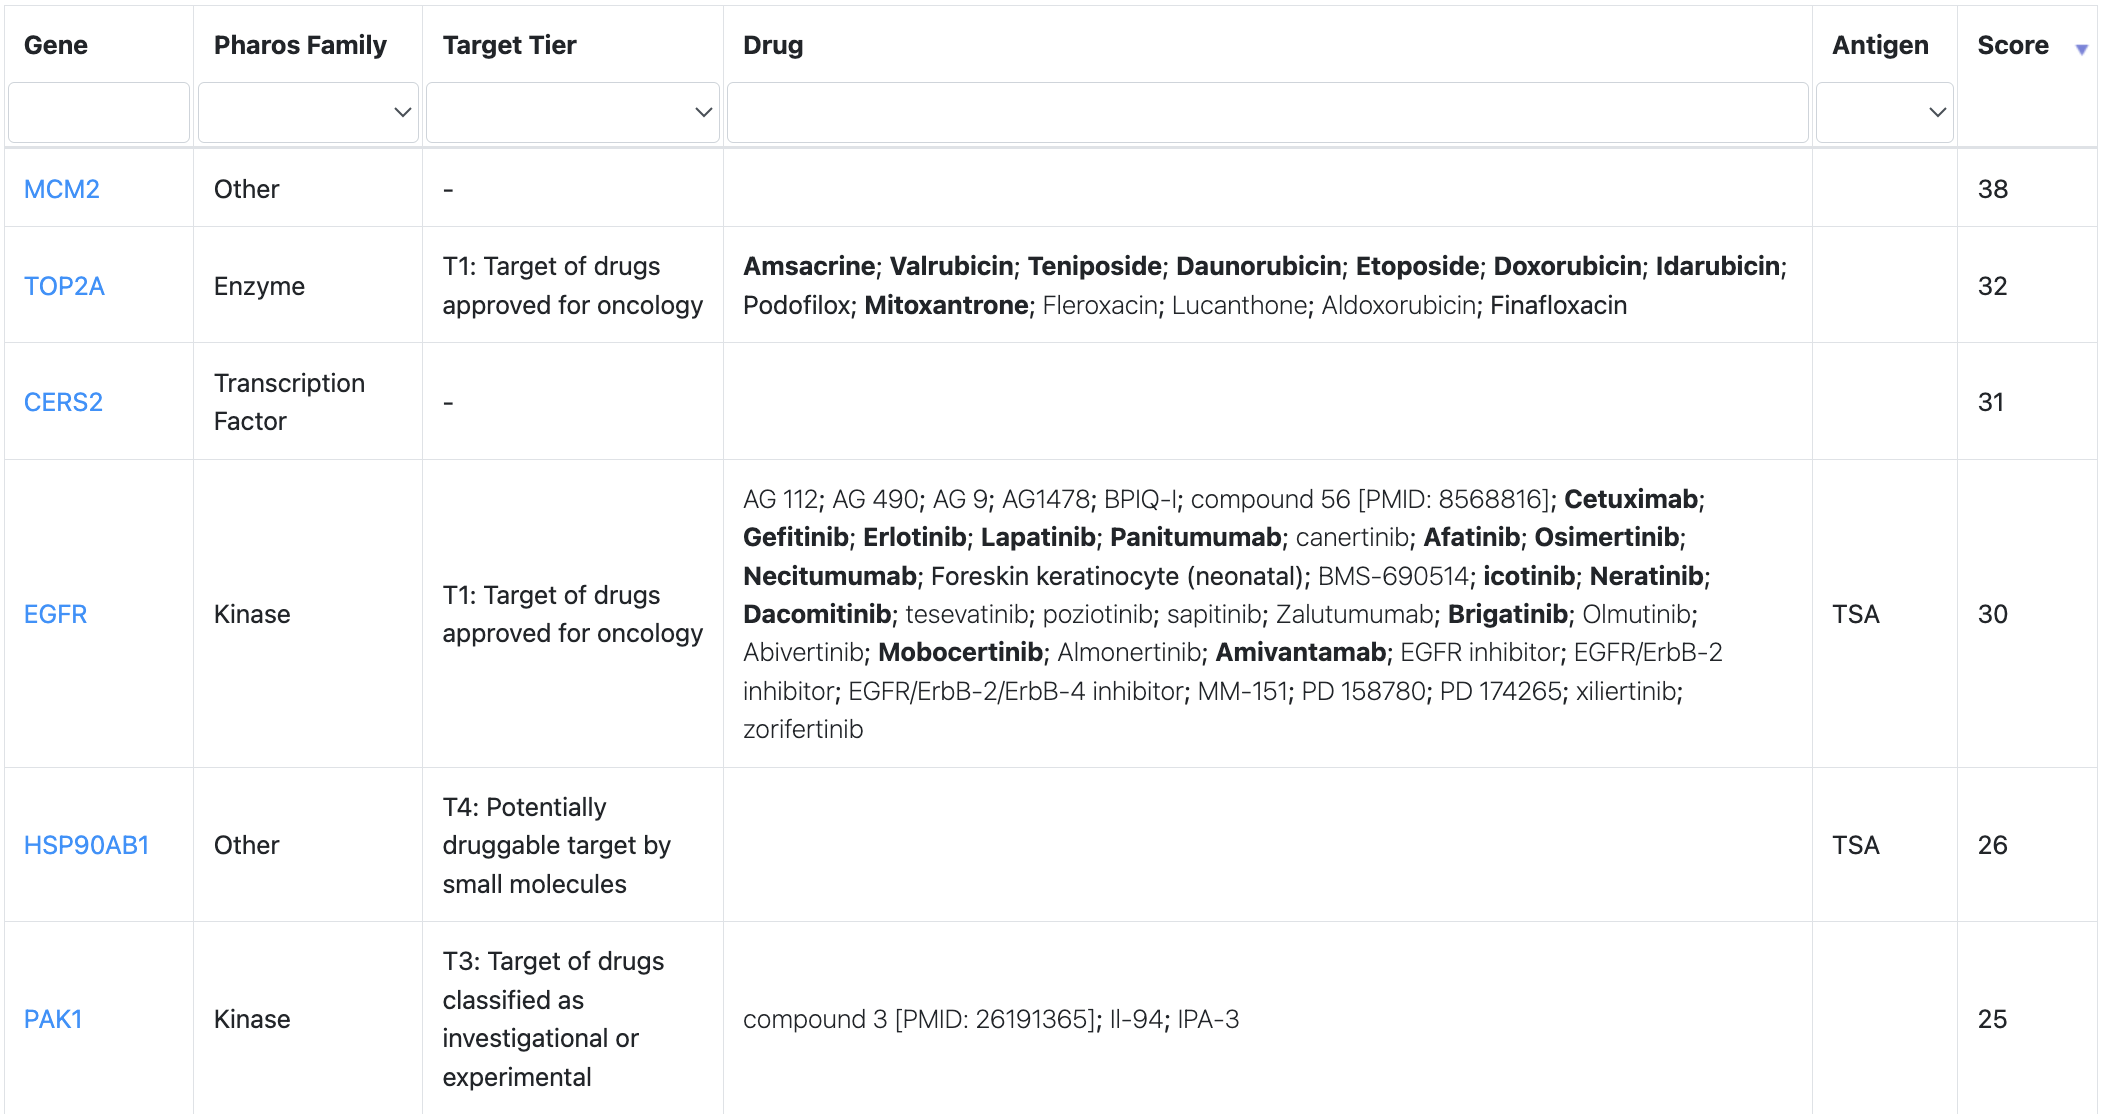
In the front page, the table summarizes analysis results for all human protein-coding genes, including 2863 druggable proteins defined by our five tiers. The total number of significant results in all types of analyses is summed in the score column, which could be used to sort and prioritize genes. Gene can be searched by gene symbols or filtered by Pharos family, target tier, tumor-specific antigen (TSA) and tumor-associated antigen (TAA) annotations. Approved and investigational drugs are listed and emphasized by different font weight, with approved oncology drugs being the boldest.
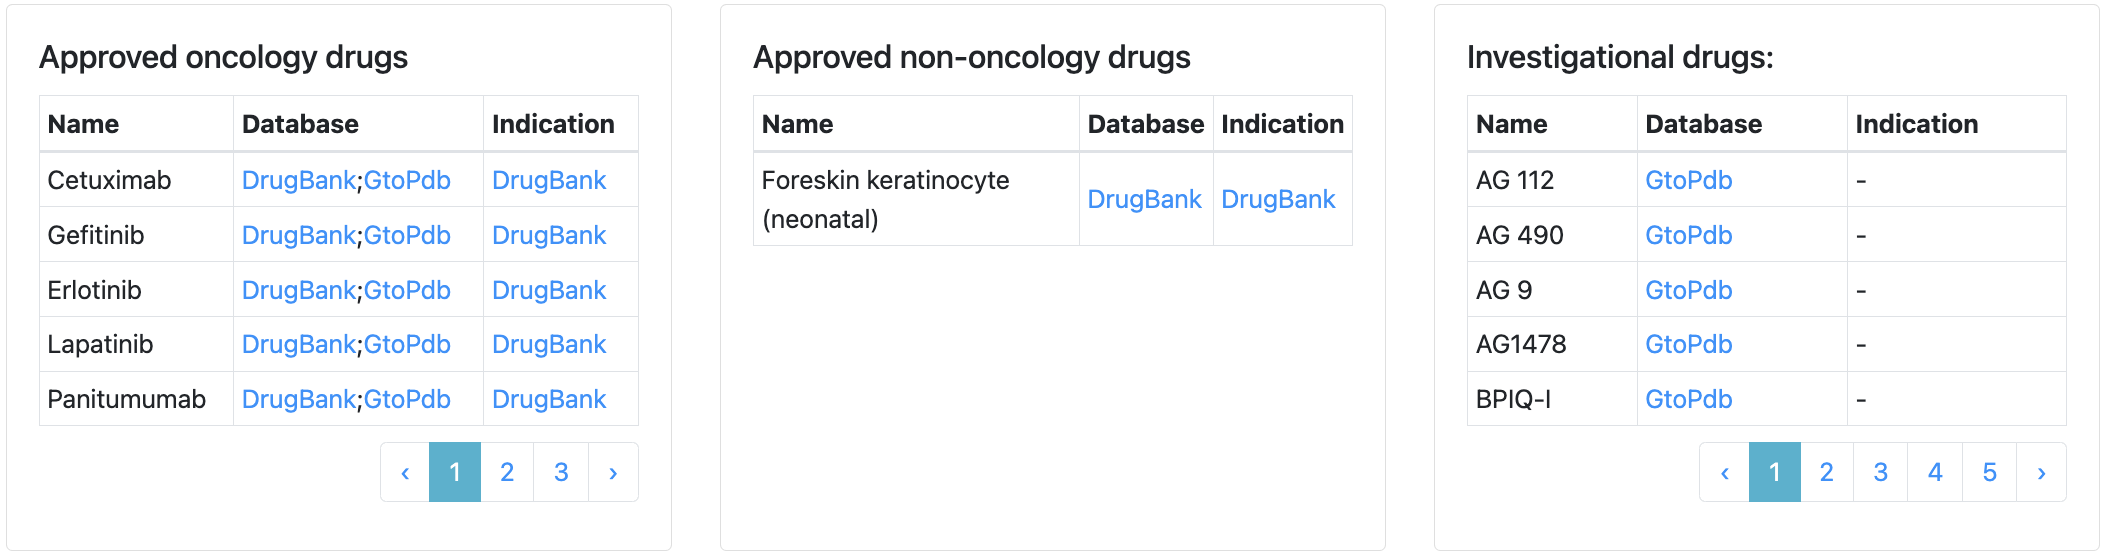
On the webpage of each gene, there are tables listing drugs in the three categories (approved oncology drugs, approved non-oncology drugs, and investigational drugs) separately, with links to either DrugBank or Guide to Pharmacology website.
The heatmap represents significant results in each analysis category and cancer type as green boxes. The green boxes can be clicked to see the data plot or result table. Overexpression of protein and phosphosites in tumor are grouped together as one summary row that can be expanded. Each category of analysis is explained below.
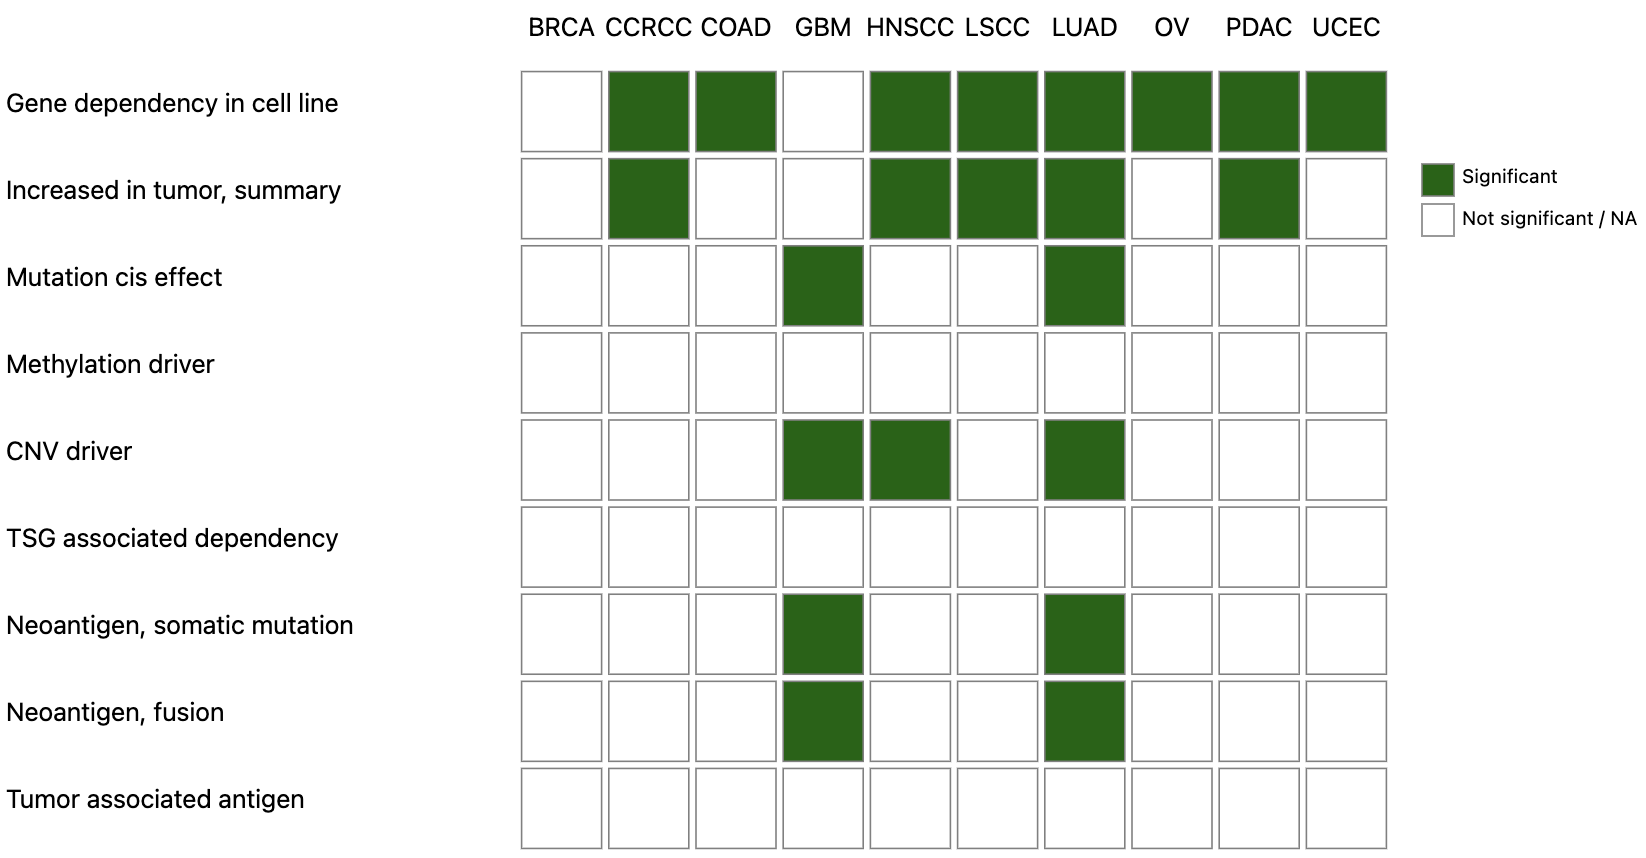
- Gene dependency in cell line
- A box plot showing gene effect score distribution of CRISPR knockout screens in matched cell lines from DepMap. One-tailed T-test is used for identifying genes with significantly reduced cell growth following gene knockout.
- Increased in tumor, protein and phosphosite
- A pair of box plots comparing protein or phosphosite abundance in tumor and normal tissues. Unpaired Wilcoxon Rank Sum test is used for differential expression analysis.
- Mutation cis effect
- Two box plots comparing protein and mRNA abundance in mutated and wild type samples. T-test is used for statistical significance testing.
- Methylation driver
- Hypermethylated genes are first identified by comparing tumor and normal tissues with a p-value cutoff of 0.01. Spearman’s correlation with protein and mRNA abundance is then used to find drivers (p-value < 0.01). Two scatter plots are shown for the relationship between methylation level and protein/mRNA abundance respectively.
- CNV driver
- Amplified genes are first identified by GISTIC2 with a cutoff of +/-0.3 and p-value of 0.1. Spearman’s correlation with protein and mRNA abundance is then used to find drivers (p-value < 0.01). Two scatter plots are shown for the relationship between copy number variation level and protein/mRNA abundance respectively.
- TSG associated dependency
- Paired relationships between genomic loss of tumor suppressor genes with protein abundance, phosphosite abundance, and inferred kinase activity scores were first examined in tumors. For each cancer type, Wilcoxon Rank Sum test was used to compare protein/phosphosite/kinase activity scores in samples with genomic loss of tumor suppressor gene loss vs rest. Signed -log10 p-values > 0 were used for plotting with values > 0 indicating upregulation of protein/phosphosite/kinase activity in samples with genomic loss of the tumor suppressor gene. Each pair was also evaluated using CRISPR-Cas9 screen data from DepMap in matched cancer lineages to test if cell lines that harbor tumor suppressor gene loss (frameshift/nonsense mutation, deep deletion) were more dependent on the host protein gene vs lines without those aberrations by Wilcoxon Rank Sum test. Signed -log10 values < 0 were used for plotting with values < 0 indicating greater loss in fitness when host gene is KO by CRISPR in cells with tumor suppressor gene loss.
- Neoantigen, somatic mutation and fusion
- A table of predicted neoepitopes with proteomics evidence caused by somatic mutation or gene fusions is shown.
- Tumor associated antigen
- AD test was used for differential expression analysis between tumor and normal tissues. A pair of box plots of protein abundance is shown. Probability of the gene expression in normal tissues calculate from GTEx data is also shown in a table to identify dormant proteins that are not expressed in normal tissues other than testis.